Background
The CBP is a statewide price-responsive and aggregator-managed program launched in 2007. It is available at the three CA Investor Owned Utilities (IOUs) – Pacific Gas & Electric, Southern California Edison, and San Diego Gas & Electric. However, each utility’s program differs in program features and operations. The program is locationally dispatched upon CAISO market awards to target geographic areas of high demand. The 2022 program included 722 participants (residential and non-residential) and provided approximately 32 MW of load reduction.
AEG has been conducting the impact evaluation of the CBP program since 2015. Over that time, we have seen the program transform from a peak shaving peak capacity program into the locational non-wires alternative program that it is today. This case study presents some of the key findings from the PY2022 evaluation.
Study Goals
Study goals included the following analysis in adherence to the CA load impact protocols.
- Estimate hourly ex-post load impacts for each utility program and dispatched event in the relevant program year.
- Develop a monthly 11-year normalized ex-ante forecast of load impacts for utility each program.
Overview of Analysis
We used a consistent methodology across all programs. Each program is modeled independently, modifying assumptions to account for program design and implementation specific to each IOU’s CBP tariff.
- The Residential ex-post analysis used a matched control group and aggregate hourly regression models. This approach is the best practice for participant populations with less variable loads, which can leverage the higher statistical power with more customers included in each model. A matched control group also more effectively estimates the counterfactual load without a randomized control trial.
- The Non-residential ex-post analyses used a within-subject design and customer-specific hourly regression models. Non-residential customers often vary significantly from one another in load shape, weather response, and overall size. Customer-specific regressions allow us to control for variation in load due to weather conditions, geography, time-related variables, and other unobservable customer-specific effects.
- The ex-ante forecast leverages ex-post hourly regression models to predict impacts under the Utility and CAISO 1-in-2 and 1-in-10 weather scenarios.
Key Results
The CBP program continues to be successful and bringing load impacts to the State, in total just over 32 MW on the average summer event day in PY 2022. It is important to note that greater capacity is available if needed for an emergency, the total average summer nominated capacity (vs. dispatched or needed) was 57 MW statewide and during PG&E’s 4 system-wide events (in September) the load impact exceeded 60 MW.
From a forward-looking perspective, all three utilities expect their programs to grow in the coming years with a total average summer event day load impact of approximately 41 MW expected statewide by 2025, an increase of more than 25%.
Ex-post Results from PY2022
The utilities offer two general flavors of programs based on notification type, either Day Ahead (DA) or Day Of (DO). In 2022, PG&E offered only DA programs. SCE and SDG&E offered both DA and DO programs. All three IOUs only had Non-residential active programs.
The table below presents the PY2022 average summer event day impacts by IOU and program at the aggregate and per-customer levels. We show the results for the most dispatched hour (reporting hour) for each program, which is HE19 (6 PM – 7 PM) for PG&E and SDG&E and HE16 (3 PM – 4 PM) for SCE.
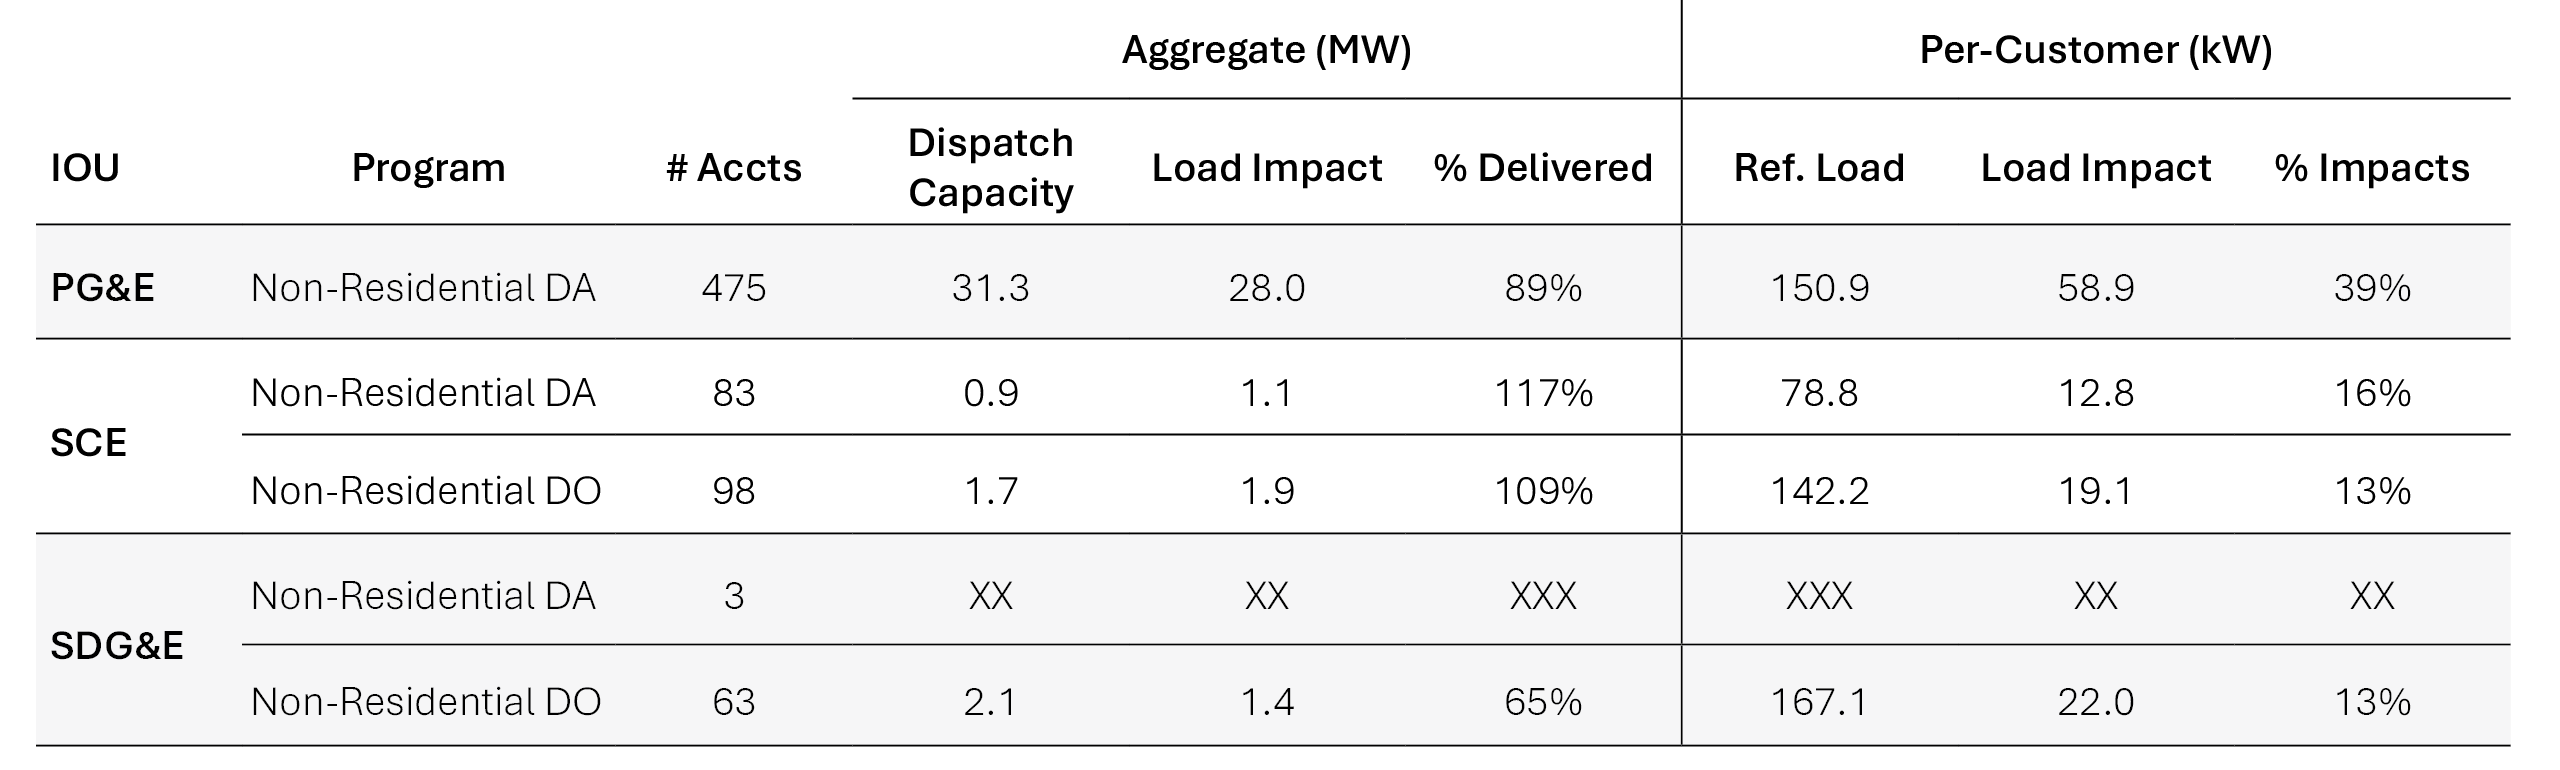
Statewide CBP Impacts Summary, Average Summer Event Day PY2022
At the program level, we observe the following:
- PG&E has the largest program, with over 475 participating accounts and a load impact of 28 MW, nearly 90% of the statewide impact. PG&E’s average delivery performance, which is measured by the ratio of the evaluated load impact to the dispatched capacity, decreased slightly at (89%) compared to PY2021 (96%).
- SCE has about 100 participating accounts in each of their programs, generating about 1-2 MW of load reduction each. SCE’s average delivery performance improved significantly, relative to last year with both programs above 100%.
- SDG&E has the smallest program, with just over 1 MW of load reduction. The Non-Residential DO improved average delivery performance (65%) compared to PY2021 (30%).
Ex-ante Results from PY2022
The table below summarizes the 11-year average load impact forecast by IOU and program for an August peak day scenario. All three utilities expect their programs to grow over the timeframe.
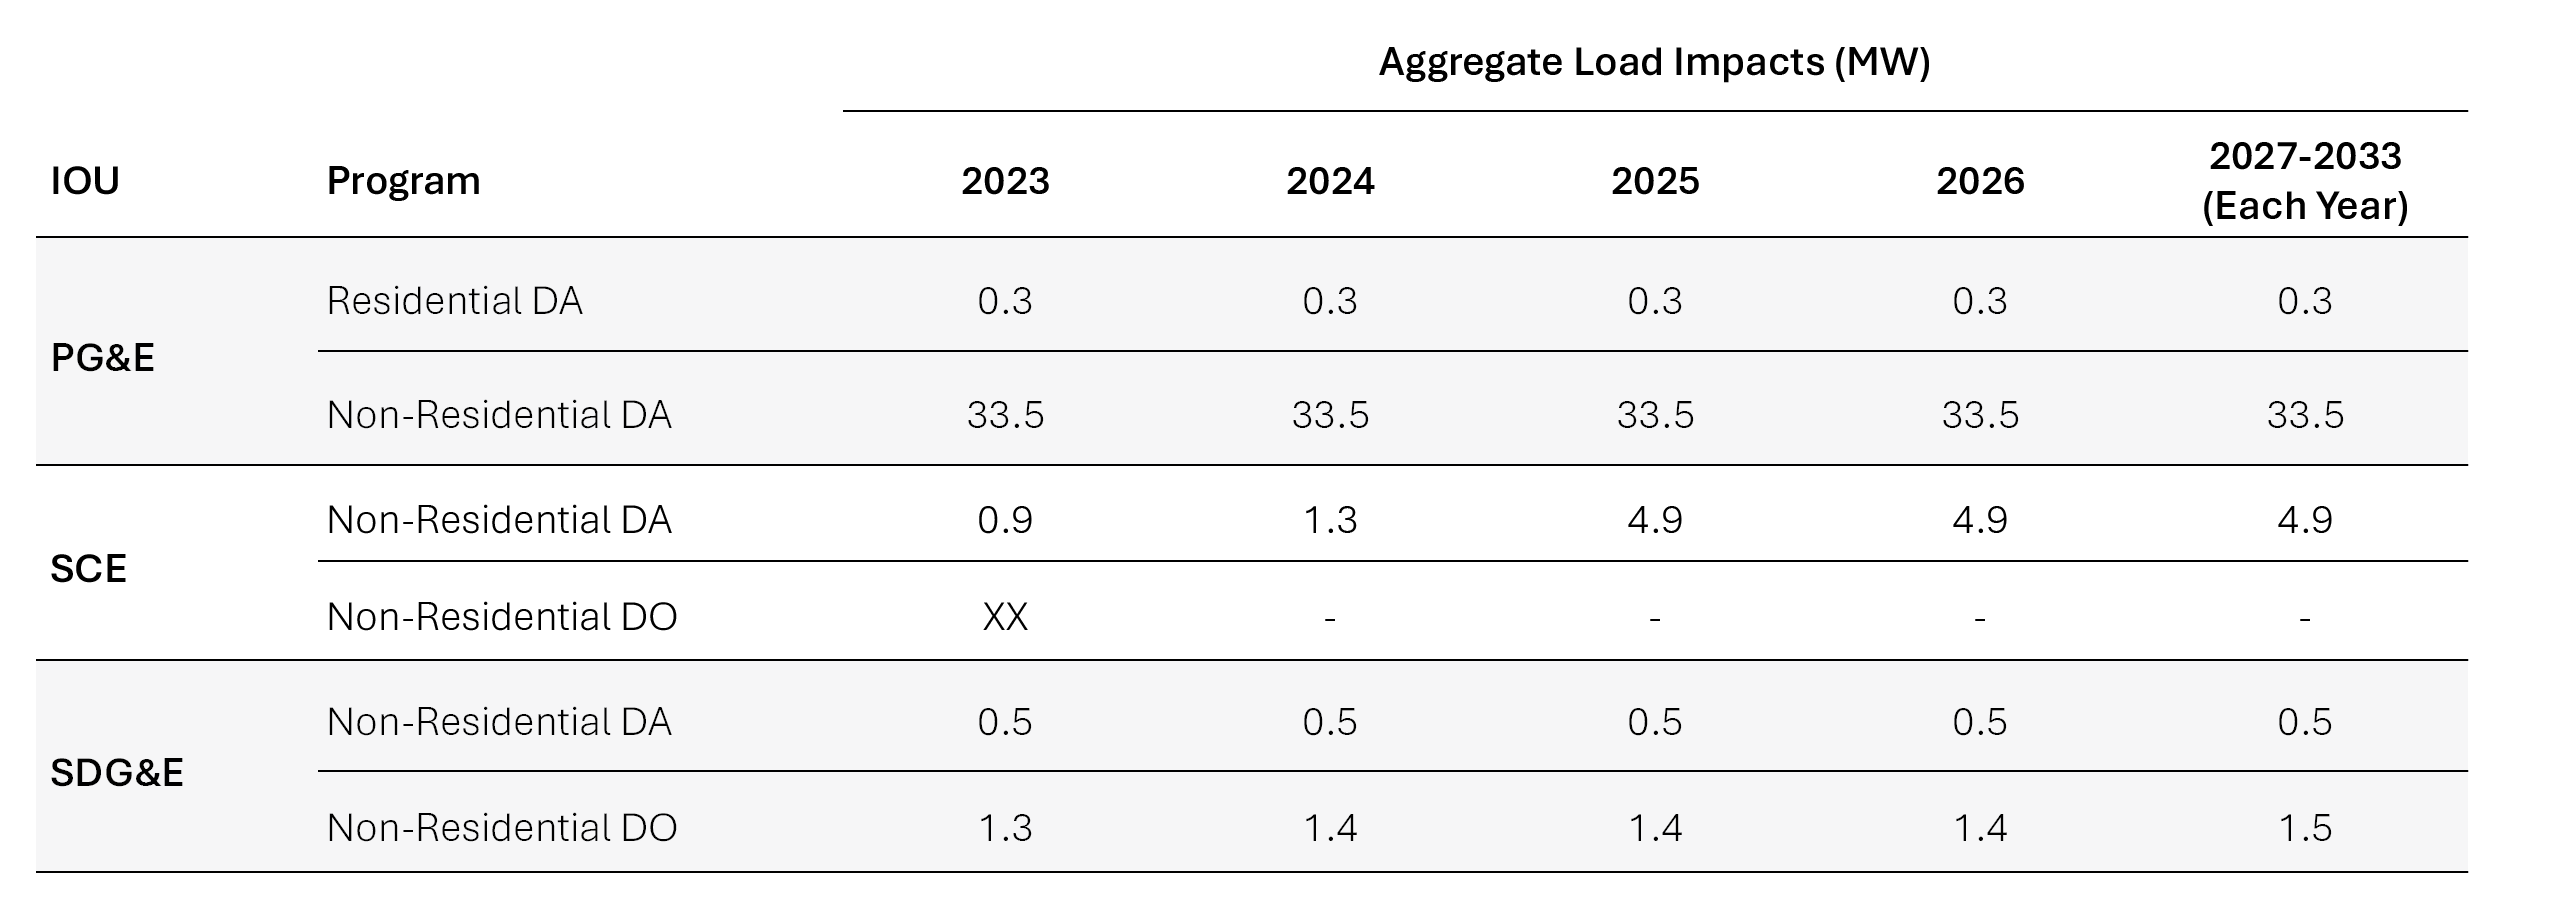 Statewide CBP: 2023-2033 Load Impact Forecast, August Peak Day
Looking to learn more about AEG services or solutions?
Talk with one of our experts today.